Plotting measured data with gnuplot
In conjunction with a physics lecture I am attending this semester a fellow student and I had to create a measurement report of an experiment we did. Working on that report I realized that I had never before felt the need for plotting measured data with a computer. Therefore I naturally did not know what freely available tool could help me with that task. Another fellow student then pointet out gnuplot to me and I gave it a try. And what can I say. I was able to create the desired plot very fast and it was pretty too.
About gnuplot:
“Gnuplot is a portable command-line driven interactive data and function plotting utility for UNIX, IBM OS/2, MS Windows, DOS, Macintosh, VMS, Atari and many other platforms.”
One of our final results looked like this: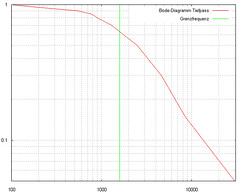
This illustrates of course only the very basic features of the tool. It’s much more powerfull than our example shows.
Some usefull commands I used to customize the plot:
As I wanted a double logarithmic scale I typed
set logscale xy
I also wanted to see the scale in my plot so I typed
set grid xtics mxtics ytics mytics
I set the lables of the axes with
set xlabel “x name” and set ylabel “y name”
(btw this labeling can also be enhanced with LaTeX style formula expressions)
and I defined the axes’ ranges with
set xrange [1:100] and set yrange [1:100]
the smoothing (interpolation) of the curve can be accomplished by specifying
smooth csplines or smooth bezier
within the plot command.
No Comments
Sorry, the comment form is closed at this time.