Visualizing Multithreading
I’ve been pondering about the question of how to model and visualize multithreaded applications in a simple, efficient and aesthetic way. Naturally I’ve been looking into UML behavior diagrams first but I was not really satisfied with what I found. Now I am not an expert on UML but I know my way around class diagrams, activity diagrams, sequence diagram and state machines but they all did not seem to fit what I wanted to visualize.
I wanted to show multiple threads communicating and synchronizing with each other. I’ve read the argument that something like multithreading concerns only the implementation of a system and can thus be ignored when modeling. I agree with the argument however there will come a time in the development phase of a system when one needs to think about multithreading and one wants to sketch out how the system facilitates multiple threads to be efficient. And for that I have not found good tool within UML.

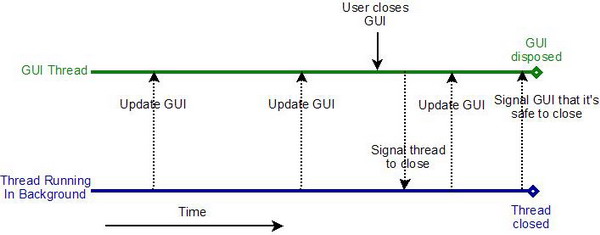
So I searched for examples of diagrams that visualize multithreading. The collage shows 4 different diagrams I found rather interesting. The first one is from this page about a traffic simulator written in Java (orignal image). It shows different threads and how they signal each other. It’s simple yet quite clear what is going an. The second image is taken from a CodeProject documentation about a genetic library (original image). It sort of uses UML symbols but it’s not clear what happens at the fork and join points. The way I figure it, those symbols inside the threads are supposed to be branches not forks. The third image is also from a CodeProject page – this time it’s a how-to about avoiding an exception when using multiple threads (original image). It reminds me of a sequence diagram. There are no blocking states in the diagram and I figure in this particular application the threads are non-blocking so diagram fits the application perfectly. The fourth diagram I liked the most. It’s from the Multithreaded Programming with ThreadMentor tutorial (original image) and has special symbols for sending signals and waiting for signals.

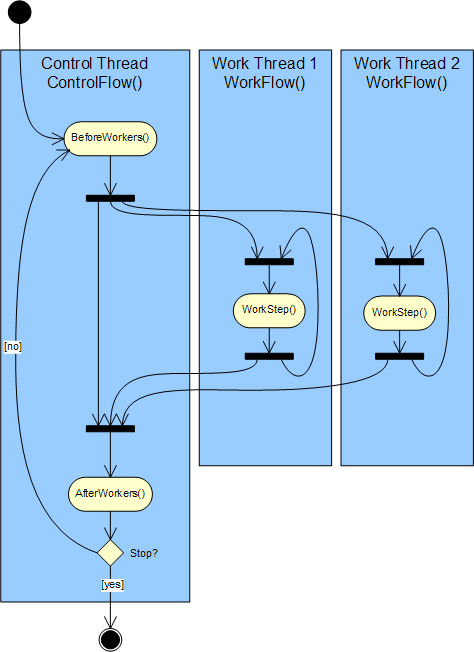
So I gave it a try myself and tried to model a simple controller and worker thread scenario based on the last of the example diagrams I found. The gray boxes and circle represent a signaling concept where one thread can send a signal and the other thread waits until it receives the signal. I also included a shared variable that handles the task shutdown. One thread can set the variable and the other branches depending on that variable. I am not happy yet with this particular part of the image. If anyone has a better idea or pointer to resources on that topic feel free to leave a comment.
10 Comments
Sure there is :-)
Thanks for this article. Just what I was looking for.
I’m not here. I’m just a figment of this website’s imagination =)
Arun, I used Inkscape to create the diagram.
Thanks,this diagram is very good.
Nice one! I was wondering how the representation can be extended to visualize critical sections/locks.. Any ideas?
Thank You, Sebastian, your article is interesing for me.
Nice Article… preparing to explain a multi-threaded/multi-task process to some people and looking for ideas. Nice work.
Sorry, the comment form is closed at this time.
What’s up, is there anybody else here?
If there’s anyone else here, let me know.
Oh, and yes I’m a real person LOL.
See ya,