Visualization of Social Network
Update: I created a tool to convert CSV files to Walrus compatible LibSea files. Check out walruscvs here You can find additional social network visualizations here.
For a long time now I have been a great admirer of Matthew Hurst’s work and I’m continuously impressed by the works posted at visualcomplexity.com. So I decided it was time for me to try something like this myself.
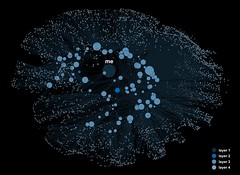
What I did is write a program that is able to log in to a very popular German Social Networking website and grab some data from it. I grabbed the friends of my profile (only 2) their friends (about 100) and the friends of their friends (about 5000). I used PHP with cURL for that and saved the data to a MySQL database.
Then I looked for tools to visualize the data. Turns out it’s quite hard to find something suitable. Here’s an (incomplete) list of tools one can choose from. Ultimately I ended up using Pajek and Walrus.
The results I got from Pajek were a bit disappointing as the network creation algorithm does not seem to work that well on very large (>5000) nodes and it is unable to render images that emphasize a 3D feeling (so no eye candy):

However I was able to create two videos of the networks I rendered. Check out video1 here, a visualization of a very small network, and video2, which shows the entire network.
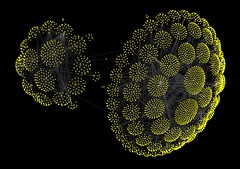
The results I got with Walrus where definitely better. It was quite complicated to get Walrus to accept my data as it heavily relies on a spanning tree, but I managed to get it to work:
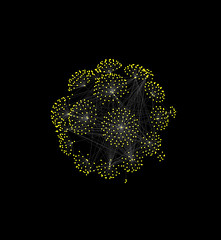
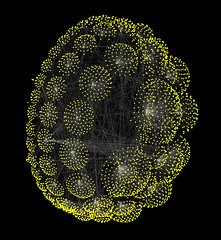
I also was able to create a video of the network I rendered with Walrus, check it out here.
My work of course is not as sophisticated as the items mentioned at the beginning but I still like some of my graphs.
17 Comments
I have almost the same problem as above.
I would greatly appreciate if you could advice me whether you came up with any way / tool to convert a pajek file to a walrus file. Pajek seems great for analysis but walrus is a better visualizer, so I need them both.
Thanks,
/praveen
You basically have to create a directed graph from your undirected data to visualize it with walrus. It’s quite some time ago I did this but I had all the data in a database and was therefore able to generate a directed graph very easily.
I have not created a tool to convert pajek files into walrus files, as I said I just created the input files from my database for the different tools I used.
Very interesting work! It shows again, how careful one should be when using a social networking site. By the way, how did you get around the StudiVZ captcha protection against spidering their website? Last time I tried, after some spidered profiles it always popped up such a thing to prevent from scraping their pages?
Back when I did this work StudiVZ didn’t have captcha protection. I think the one they have now could be defeated but I never tried. Their Use Policy is very restrictive nowadays and they forbid all the fun things one could do with the data (or even gathering the data).
hi, I am also working with giant social network layout these days. i am working with a real world phone call network about 800k nodes and 1.7mil edges. i analysis this net with igaph in R, and pajek also. However, these two software did no help about my layout work. I am hoping to try the Walrus , but how to prepare the .graph input i could solve. the net i also saved in a sqlserver database 3-triple format like ‘ Node Node Weight’. Could u share ur tools with me?
Hello,
We are working at an implementation of a social network having the possibility to:
– handle tens of millions of vertices
– insert hundreds of millions of edges
– run on a single machine
– be a scalable solution
– do social network analysis
– make real-time update of the network:
– millions of new vertices
– hundreds of million of new edges
The solution could be adapted to fit many types of social networks that have special needs of huge amount of inserts/updates.
We are looking for partners to be able to continue our project and to integrate our piece of code into their products.
For the interested persons we are able to deliver a demo to demonstrate the concept.
Please contact me at:
mihaescu AT gmail DOT com
Thanks!
Don’t know if you are still interested in this but I am currently working on a project to map a performing arts database. Currently I am using Visone Which does some impressive 2d graphs and also Biolayout 3d, which is great for looking at a network from a 3d angle.
I am going to check out walrus now as visone and biolayout are crashing on the data I am trying to analyze currently (7000+ rows)
Hi Nathan,
sure I’m still interested in this. I recently created walruscsv, a tool to convert CSV files into walrus file format. Check it out here: http://www.soa-world.de/echelon/2008/10/convertig-csv-files-to-libsea-graph-files-for-caidas-walrus.html
Maybe the tool helps with your work!
Hi,
Can anyone tell me what is the correct way to do that labels appears in the visualization of my graph file?
I think that my syntax is wrong:
{
@name=$label;
@type=string;
@default=||-none-||;
@nodeValues=[
{ @id=0; @value=”Root”; },
{ @id=1; @value=”Node A”; },
{ @id=2; @value=”Node B”; }
];
I appreciate your help.
Daniel, thanks for your comment.
Could you maybe upload the entire walrus file some place so we can have a look? If you can’t upload it send it to echelon.blog@gmail.com and I’ll do it. Or you could use http://pastebin.com/
Hi, I’ve been using yED to show my clients some directed graphs until I saw what you did with Walrus! The problem is that I don’t know where to beggin… Is there an easy tutorial for Walrus? I’d appreciate any help. Thanx!
Ana,
there’s no tutorial but walrus itself comes with pretty good documentation how to use it and very good documentation about how the input file should be specified. Everything is very well explained with examples. If you’ve got questions concerning a particular problem I might be able to help you out.
Sebastian
Hi Sebastian, thank you for answering! I’ve been playing a little with the files you’ve posted and I’d like to know how did you connected the nontree links; also if there’s a way to paint the different branches in different colors.
I have tons of questions but I’ll try to figure it out by reading the guide ;-)
Thanx!
Ana,
I’m not sure what you mean by non-tree links. All nodes have to be part of the tree and of the spanning tree as well. If you want to display multiple trees you can simply connect the root nodes of those trees to form a large tree.
Coloring can be done by assigning attributes to links and then choosing a color in walrus for that attribute. Hope this helps,
Sebastian
aha.. I love it geek!
Lovely stuff. I’ve been trying to do something like this to show association of links embedded on a webpage using php/curl. Would you mind sharing your source code?
Great work.
Sorry, the comment form is closed at this time.
Hi,
I too have a very large (undirected) network to visualize: about 20000 vertices and 31000 edges! How did you get Walrus to accept an undirected network like the social network that you are talking about? Please advice me on visualizing this network. I tried Pajek but it crashes.
Thanks.