Visualization of Social Network Reloaded
Update: I created a tool to convert CSV files to Walrus compatible LibSea files. Check out walruscvs here.
About one and a half years ago I spent a considerable amount of time experimenting with social network visualization. My methods to gather and generate the data for the visualization tools I used were very limited.
However just after posting my first results I stumbled upon the Studivz Statistics page created by Hagen Fritsch who crawled the entire social network within only 4 hours in November 2006. Back then security measures were virtually non existent so it was an easy thing to do. Today the Studivz (which is a German Facebook clone) uses a Captcha to prevent such endeavors.
Hagen Fritsch was so kind as to make the data he crawled available to me. Thanks Hagen! Not all the data, just the relevant pages to determine the connections between users in particular the “Friends” pages. So now after 1 and a half years I found some time to look at the data, analyze it and feed it to Walrus. Some results:

The first graph consists of 17142 nodes and 22838 links whereas 17141 links are part of the spanning tree Walrus uses for rendering. The second graph consists of 25313 nodes and 37794 links. Four levels of the social network are displayed meaning the tree’s depth is 4.


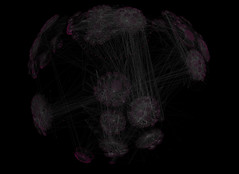
This two images show one of the largest graphs I created: 413193 nodes and 1247702 links with a tree depth of four. The left images only shows the spanning tree and the image on the right shows the entire network. When working with such large networks I encountered a couple of problems.
I was using PHP to create the Walrus graph file. Because of the spanning tree this is no trivial task and it became very clear that PHP is the wrong tool for it. A PHP script ran for about 4 hours to create a 30000 node graph file. I wanted bigger trees so I ported the PHP script to C++ and was surprised to find that the same task took mere seconds. This is not due to inefficient coding but PHP definitely has problems when dealing with huge junks of data especially when they are stored in associative arrays. In C++ I used hash_maps which worked out perfectly. Here are two more images of the above network:


My Celeron 1.7GHz 512MB RAM workstation thought I was being ridiculous when I loaded the 60MB text file that contained the graph into Walrus. After some swapping and heavy calculation it worked reasonably well though.
If you feel like playing around with Walrus and the data here’s a zip file containing the 3 networks on display. You can get Walrus form here. Start Walrus with the following command:
java -Xmx512m -cp mp.jar;antlrall-mod.jar;libsea.jar;walrus.jar H3Main
I added the “-Xmx512m” part to allow java to allocate more memory. This is necessary for the very large graph file. Enjoy! I will try to add a video in the next couple of days. I was also able to extract the university each of the members of the social networks attends so there are a couple of possibilities to create more visualizations.
2 Comments
This is awesome. I was playing with Walrus a while back to visualize IT security data. Unfortunately, I didn’t ind anything that would let me compute the spanning tree. I am very excited to try your implementation and use it to visualize some security data. Thanks!
Sorry, the comment form is closed at this time.
Hast du Lust bei uns Praktikum zu machen? :)