Archive for the ‘personal’ Category

Visualization of Social Network

Sunday, January 21st, 2007

Update: I created a tool to convert CSV files to Walrus compatible LibSea files. Check out walruscvs here You can find additional social network visualizations here.

For a long time now I have been a great admirer of Matthew Hurst’s work and I’m continuously impressed by the works posted at visualcomplexity.com. So I decided it was time for me to try something like this myself.

Visualization of large Social Network

What I did is write a program that is able to log in to a very popular German Social Networking website and grab some data from it. I grabbed the friends of my profile (only 2) their friends (about 100) and the friends of their friends (about 5000). I used PHP with cURL for that and saved the data to a MySQL database.

Visualization of large Social Network

Then I looked for tools to visualize the data. Turns out it’s quite hard to find something suitable. Here’s an (incomplete) list of tools one can choose from. Ultimately I ended up using Pajek and Walrus.

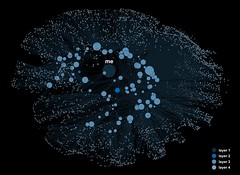
The results I got from Pajek were a bit disappointing as the network creation algorithm does not seem to work that well on very large (>5000) nodes and it is unable to render images that emphasize a 3D feeling (so no eye candy):

Chaotic Visualization of large Social Network

However I was able to create two videos of the networks I rendered. Check out video1 here, a visualization of a very small network, and video2, which shows the entire network.

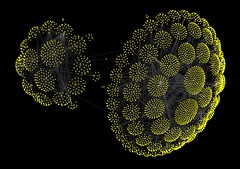
The results I got with Walrus where definitely better. It was quite complicated to get Walrus to accept my data as it heavily relies on a spanning tree, but I managed to get it to work:

Visualization of large Social Network with Walrus Visualization of large Social Network with Walrus

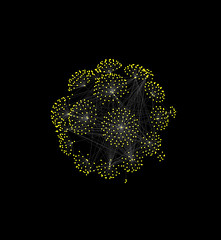
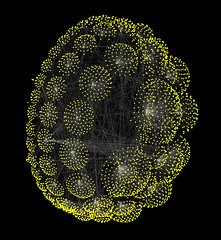
I also was able to create a video of the network I rendered with Walrus, check it out here.

My work of course is not as sophisticated as the items mentioned at the beginning but I still like some of my graphs.

Free Music

Tuesday, December 19th, 2006

A Free Music page was added to the echelon blog. It’s a site to satisfy my need for posting songs I personally like very much to the blog.
All songs so far are from the Bavarian Open Source website. A very cool page where one can download songs from many known and unknown bands. Among the known being “Adam Green”, “The Kaiser Chiefs”, “Mediengruppe Telekomander” and “Deichkind”. Among the unknown being for example “Miwon” and “Lagoon”. It’s a very cool page and a very cool idea. They also have a Top20 list.

On another note, the complete Mozart works are now freely available on the Internet. The International Mozart Foundation apparently “aquired the right to publish the prestigious New Mozart Edition of every Mozart work” (from slashdot). Cool!

Break up songs

Saturday, November 25th, 2006

This is probably the worst post to this blog so far so stand ready for this. It’s going to be very personal (obviously) and very pathetic: a list of break up songs. No, I don’t intend to copy the stupid “High Fidelity” flick (actually it’s not that bad – I just don’t like it). But I want to get that list out in the world. And there’s something for you in it too. The first song can be downloaded for free. (more…)

Plotting measured data with gnuplot

Wednesday, November 8th, 2006

In conjunction with a physics lecture I am attending this semester a fellow student and I had to create a measurement report of an experiment we did. Working on that report I realized that I had never before felt the need for plotting measured data with a computer. Therefore I naturally did not know what freely available tool could help me with that task. Another fellow student then pointet out gnuplot to me and I gave it a try. And what can I say. I was able to create the desired plot very fast and it was pretty too.

About gnuplot:
Gnuplot is a portable command-line driven interactive data and function plotting utility for UNIX, IBM OS/2, MS Windows, DOS, Macintosh, VMS, Atari and many other platforms.”

One of our final results looked like this:
tiefpass
This illustrates of course only the very basic features of the tool. It’s much more powerfull than our example shows.

Some usefull commands I used to customize the plot:
As I wanted a double logarithmic scale I typed
set logscale xy
I also wanted to see the scale in my plot so I typed
set grid xtics mxtics ytics mytics
I set the lables of the axes with
set xlabel “x name” and set ylabel “y name”
(btw this labeling can also be enhanced with LaTeX style formula expressions)
and I defined the axes’ ranges with
set xrange [1:100] and set yrange [1:100]
the smoothing (interpolation) of the curve can be accomplished by specifying
smooth csplines or smooth bezier
within the plot command.

Rip MP3s off Youtube

Monday, October 23rd, 2006

Ok, this is probably very very old news for the people out there but I’ll describe what I discovered today anyway. Here’s the deal: I heard one song the last two days on the radio which I liked very much. It’s “Gabriel Rios – Broad Daylight” if you must know. I wanted to have that song on my mp3 player so what I basically did is pirate it. From YouTube!

(more…)

Wallpapers

Thursday, October 5th, 2006

Some Wallpapers created from self-made pictures.

paris_at_night street_light_at_railroad_station
“Paris at night” & “Street light at railroad station”
The first one is a wallpaper made from 4 pictures that were taken from the Tour Monparnasse in Paris. It’s called “Paris at night”. (more…)

Radio Stations

Monday, September 25th, 2006

Today I present three great (Internet) radio stations. One is located in Munich, Germany, one in Paris, France and one in Vienna, Austria. They all play the newest alternative and independent Rock-, Pop-, Electro, and Dancemusic. As they are located in different places in Europe one can hear a wide variety of music.

(more…)