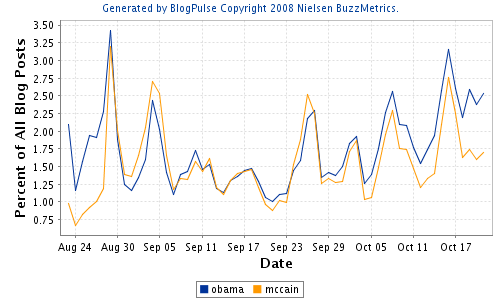
This post lists a couple of more or less random thoughts on blog analysis, data mining, social media analysis and sentiment analysis. I’d like to start out with an interesting graph from blogpulse.com comparing the number of blog posts that talk about the two candidates for U.S. presidency Senator McCain and Senator Obama:

Looking at that graph without thinking about it one might say: well, looks like the democratic candidate is winning. But all this graph shows is that people talk more about Senator Obama at the moment. The graph doesn’t show if the blog posts are positive or negative. One might argue that any attention is good attention but it’s hard to tell from the graph. Additionally I suspect that when writing about the presidential race, chances are both candidates are mentioned. I’m doing it right in this post. So I’m not one hundred percent sure what the divergence of the trends means.
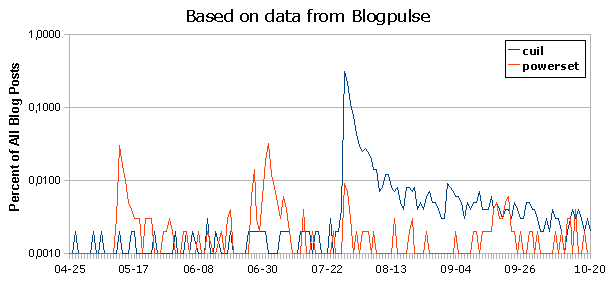
But extracting keywords is only the beginning. What we really want is a tool that is capable of some form of natural language processing. It should to some degree be able to understand the text it is analyzing in order to extract its sentiment or the connotation associated with certain words or phrases. There are numerous experiments in that direction out there, the most prominent being powerset. They got quite a bit of media attention and they were praised as being Google’s successor and then got bought by Microsoft. For the fun of it here’s a comparison of powerset and cuil buzz created with data from blogpulse.com:

Please notice the logarithmic scale on that graph. I guess the point I’m trying to make with that graph is that ever since they got bought it got kind of quiet around the powerset guys. They are probably integrating their technology into Microsoft’s search engine.
Speaking of Microsoft, the Datamining Blog talks a lot about social streams and in particular the politics implementation. From the blog posts and the FAQ I conclude that they are building some kind of platform called “social streams” that is able to mine various social streams, preprocess the data and then apply various analysis algorithms on that data. Very interesting. They don’t want to limit themselves to blogs but really try to cover as many social media streams as possible (think Twitter or Usenet). They probably have some kind of plug-in architecture where they can add new mining components as they see fit. The data might be stored in a generic way, regardless of the source – at least that’s how I would try to do it (don’t know if it is possible). I’m looking forward to what comes out of this.
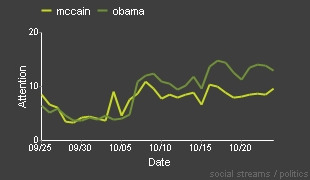
At the moment they only seem to have the afore mentioned politics application. I don’t like it that much because it mixes “news”, “blogs”, “people” and “places” in a really strange way. It gets its data from news or blogs and it is about people and places. But what are those 4 boxes telling me? Obama: People 9? Is he associated with 9 people and 9 places? The number is probably rather irrelevant. Here’s a graph similar to the first one taken from social streams:

What I’ve been thinking about doing in this area is the following: I’d like to create a simple blog analysis tool that analyzes one blog at a time. I’d like to provide a time line where one can see when and how often a new post was published. It might also be interesting to automatically extract some key words from the blog that might give you an idea what the blog is all about. Kind of what Google AdWords is doing. And finally a trend search engine that allows you to extract how often and when certain keywords are used in the blog. I thought about using the Google Feed API to grab the content of a blog’s feed in a convenient way. They also provide a history of the feeds which would allow an analysis of not only the current feed but a larger time span. If you’re interested in the Google Feed API check out this and this article.
