Update: I created a tool to convert CSV files to Walrus compatible LibSea files. Check out walruscvs here You can find additional social network visualizations here.
For a long time now I have been a great admirer of Matthew Hurst’s work and I’m continuously impressed by the works posted at visualcomplexity.com. So I decided it was time for me to try something like this myself.
What I did is write a program that is able to log in to a very popular German Social Networking website and grab some data from it. I grabbed the friends of my profile (only 2) their friends (about 100) and the friends of their friends (about 5000). I used PHP with cURL for that and saved the data to a MySQL database.
Then I looked for tools to visualize the data. Turns out it’s quite hard to find something suitable. Here’s an (incomplete) list of tools one can choose from. Ultimately I ended up using Pajek and Walrus.
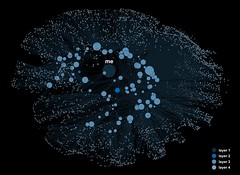
The results I got from Pajek were a bit disappointing as the network creation algorithm does not seem to work that well on very large (>5000) nodes and it is unable to render images that emphasize a 3D feeling (so no eye candy):
However I was able to create two videos of the networks I rendered. Check out video1 here, a visualization of a very small network, and video2, which shows the entire network.
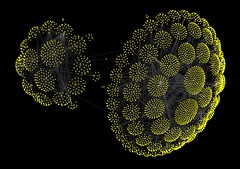
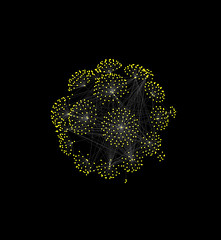
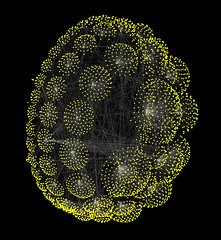
The results I got with Walrus where definitely better. It was quite complicated to get Walrus to accept my data as it heavily relies on a spanning tree, but I managed to get it to work:
I also was able to create a video of the network I rendered with Walrus, check it out here.
My work of course is not as sophisticated as the items mentioned at the beginning but I still like some of my graphs.
