Quite a few responses to my posts about social network visualization with Walrus contained questions about how to create the input files for Walrus. Walrus itself is very well documented and the LibSea graph file format is also explained in detail. But people seem to run into trouble when trying to create the spanning tree required for Walrus.

The Walrus documentation states that it only makes sense to visualize data that contain a meaningful spanning tree and that visualizations created with the help of an arbitrary spanning tree are not very useful. While that’s probably true the visualizations still look awesome. And I guess that’s what people want. Furthermore Raffael Marty from secviz.org contacted me and asked if I had a tool that could read CSV files as input and output a LibSea file for Walrus.
I didn’t have such a tool but it sounded like a fun challenge and I thought that such a tool might also help all the people who run into trouble when trying to create a spanning tree for their graphs. So I created walruscsv – a command line tool written in C++ that reads a CSV and outputs a LibSea graph file that can be visualized with Walrus. The CSV file hast to contain a link in each row and consist of 2 columns. The first column in each row represents the first node of the link and the second column the second node of the link. It automatically generates an arbitrary spanning tree.
A sample CSV file containing the links node1<->node2, node1<->node3, node3<->node4 could look like this:
node1,node2
node1,node3
node3,node4
Although Walrus is only capable of visualizing one network at a time walruscsv can handle multiple networks in one CSV file. It creates an arbitrary node and connects a node of each network to that node enabling Walrus to visualize the data. Currently the tool creates an arbitrary spanning tree so it’s not weighted and therefore not minimal.
Walruscsv reads the name of the CSV file to process as the first command line parameter passed to it. It is released under a non restrictive open source license so in addition to binaries the source code is provided. To compile it using the GNU C++ compiler simply type:
g++ wlink.cpp main.cpp wtree.cpp -o walrus.exe
You can use the program by typing
walrus.exe testfile1.csv
whereas testfile1.csv is the CSV file containing the graphs you want to visualize. Bloodshed Dev-C++ can also be used to compile the code and although I didn’t try it it should also work with C++ compilers from Microsoft (e.g. using Visual Studio). Here are the files:
Source code (the source code released to the public domain)
Test files (a collection of test CSV files)
Win32 binary
Debian x86 64bit binary
If you’re having trouble using or compiling the tool or if you have suggestions or comments of if you find a bug feel free to contact me or leave a comment.


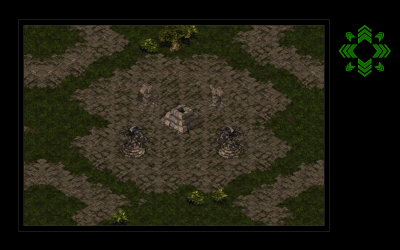
 I wrote a script that creates a pixel tile based map from a random height map and created 6 pixel tiles for the different heights. I wanted water, a beach, nice grasslands and icy mountains. To generate the height map I used Matlab. I tried a couple of different techniques and finally ended up using a


